With much aggravation taken as penance I have finally been able to put to rest a cluster of four supposed Ancestor Discoveries (Beta). Turns out the four were Grandparents of second cousin 3x named Jessie May Kelly, a grandchild of the Day family. I am fairly disappointed that they were none relatives to me and indeed come from a branch I was just pondering over regarding the percentage of shared DNA.
I have had a week recently where I have been contacted only by paternal relations to me, and those I think are outside of my x-inheritance. It makes me wonder then about the randomness of dna assignment and how much if any I can really trust Ancestry.com services. I am up to five genetic companies which have my dna sample and have rendered ethnicity lists. There is some major variation between them all, but yet also a seeming obvious underlying cause. Clustering populations together creates a wide variety. My initial thought was that where France goes so do I, but there is also a question of whether France itself is one unit. Northern France is flavored with Britain as much as east and south are peppered with other border countries. Ancestry.com is the only of five companies to declare any Irish, while FTDNA tells me I have recent Amerindian...on 23andMe my West African is disappearing by the minute.
The New Genetic Communities feature looks quite fun and I have wanted an aggregated list of birthplaces for a map for quite sometime. While I made my own by hand once or twice they never are very accurate when new data is arriving each day or even week. A major problem that seems to show up is first degree relatives getting drastically different communities. My Father for example, has at least four or five with many placed overseas or in the American south, think Confederacy. I on the other hand have only a single group for French settlers along the St. Lawrence, excluding regions relevant to my father. It seems quite odd to be sharing no groups with a parent and I have heard this from other users as well.
So what is the basis for communities? It would seem to be a macro version of dna circles, of which parents and children should share. Yet I am only seeing confusion and complaints. Given the differences in my parents ethnic background there should be more. There just isn't...
Friday, June 9, 2017
Wednesday, December 23, 2015
Non-Paternal Events
I haven't done much serious work on genealogy in a while. However recently I finally had some distant cousins and possibly great aunts/uncles inquire about a family group we share on ManitoulinRoots. It was a bit unhelpful to see someone else regurgitating photos of mine that they obviously took off my public tree however it definitely collided with the last work I did on the genetic side prior to 23andMe turning into a worthless piece of bunk. After comparing my father and I on a few of the direct tests such as Dodecad9, I took another crack at generating parental emulated files from my own sample. My father's emulated sample perfectly matched his real data so I can only assume that my mothers is more than 75% correct even without her test to confirm it.
Part of the fun on spreadsheeting my results versus my fathers in Dodecad was that I discovered I inherited his older DNA contribution. When run against my mother's 'sample' I inherited her more recent groups. Something glaringly obvious is that the south european, which I had tracked down to primarily Portuguese, is actually from my mother. It's also the most recent population addition for her estimated at two generations above her. That generation just happens to be within the Bryants who everyone is suddenly so interested in.
Ironically in this case the infidelity was entirely well known to the family. What no one ever seems to discuss is the time gaps between children and the fact that only half or less look related to each other. Something more strange is the appearance of a unique firstname for the youngest child. While the story is that the mother chose it because she admired a foreigner her brother had dated once I find that a bit odd. To add flame to this fire in researching the origin of the name I discovered that it is actually of Portuguese origin despite the Italian spelling.
So how does one really confirm a highly likely NPE? I seem to have two avenues, one to compare the male line of my great grandmother's three brothers. This could be supplemented with their sons tests but of course that means a confirmation for a non paternity could also be a illegitimacy in that younger generation. The other would be to compare the autosomnal records of the sister's children for glaring different builds. No one of course wants to confirm a non paternity for the family who raised them and who they believe is apart of their personal identity. In that sense I would require either a science and truth driven youngblood like myself or one of the closer generations who doesn't care. As of yet I have not located either.
I imagine if I was local and a bit more skilled at hard copy research I could probably discover names and dates for the unfaithful spouse after the separation. It is likely that the man who took her in as a live-in maid was also her lover. Perhaps he was Portuguese?
Sunday, June 28, 2015
Reuse, Recycle & Revision

Personally I think it is the unknown and the unsaid which are most painful discoveries. A recent genealogy thread I looked at had a entire section dedicated to the family-finder complications. That is to say an only child finding out she has three half siblings from her fathers double life or even just the child who was told the wrong person was her father. Ethnicity prediction is also a big problem for those expecting a certain result. A family of reservation Indians for example finding out they are anything but native though that is the families identity for generations. The MRAA was a push to the limits for me prompted by a small fluke I saw on a single test. The sub Saharan result was possible only as noise or a legitimate marker. As I previously stated:
Most recent intermixed cites percentages, in example from JTest, like Mozabite-Berber, Moroccan, and Algerian. Each is roughly a 2.9-3.2 in distance inside of my intermix. As for Sub-Saharan I had a test the other day ping for both Morocco and Tanzania. I also seem to have a surprising amount of Egyptian hidden around 1.7-1.9 genetic distance in decently large amounts.
Now since I am talking about broken heartstrings you have probably guess right that new testing has rocked my boat. I paid for 23andMe this summer for both the husband and myself in hopes of the mtdna which comes free giving me my subgroup. At the moment it is impossible to classify me though I am somewhere within H1. I won't give out information on my husbands details but needless to say it was a shock on all fronts. Furthermore up came a percentage of African in recent genealogy for myself. Roughly 3-4% as half western Africa and half south African. I am assuming that this may be a sensitivity issue and that what I am really seeing is the African ancestry of my own middle eastern and eurasian predecessors.
Only recently have I come to accept the amount of old world Hispanic I carry. Perhaps the Moorish invasion explains where that might also come from since between ancestry, ftdna and 23andMe my Hispanic percentage dropped. Aggravating to have paid two companies now and no one can give me my mtdna line in exact. But all of this as of late with other changes in my life I find splintering my self identity not strengthening it. Always good to take a break now and then.
Friday, January 9, 2015
Simple Geographic Projects
I have discovered in running raw data analysis that I love making maps. The heat map in the previous post was overlayed on a known births versus population matching chart. Having found yet another cool map making method I wanted to share it with you all! The goal is to find a common origin based on your largest matching populations. I had to run it twice myself because the first time came out some strange collapsing triangle.
1. Visit GEDmatch (presuming you already have genomic raw data and have an account, otherwise, acquire these)
2. Select Admixture on the main menu.
3. Insert your ID and select any of the open-source projects (MDLP, Eurogenes, Dodecad, HarappaWorld) and then any of the calculators.
4. Once the calculator has finished, click the Oracle button (not Oracle-4) underneath your generated component scores.
5. Scroll down to the bottom and inspect the "Mixed Mode Population Sharing:" results. Pick one, preferably one with the lowest genetic difference (GD) to ensure better accuracy and one which includes non-diaspora/recently non-admixed populations (localising Ashkenazi Jewish or African Americans as a donor population on a map will be difficult due to subjective guidance regarding their placement on a map).
6. Repeat the above with at least two other calculators and keep note of the results. For a minimalist approach, Europeans are better off using Eurogenes, Dodecad and MDLP. South Asians are recommended to have HarappaWorld included. Those from elsewhere in the world are free to use any combination, as none of these are specific for other regions.
7. Download this map (from Wikipedia) or the map below (for McDonald BGA version) and Paint.Net (open-source image editor). Feel free to use another editing software. I prefer Paint.Net because it indicates the 1/3 increments along any line drawn.
8. Open the map with Paint.Net/another image editor. Pinpoint your McDonald BGA average spot or physical ancestral location if desired.
9. With a colour specific to the open-source calculator you're going to use, pinpoint the location where each donor population for your selected Oracle result comes from. If uncertain, look up roughly where they're from (e.g. Pakistani Pashtuns will be around NW Pakistan close to the Afghan border). If a national average (e.g. German_Dodecad), place in the middle of the country.
10. Draw a line between both donor populations. Estimate where on the line you'll fall. Note the numbers are flipped round in practice; for instance, if the Oracle is 70% German + 30% Ukrainian, the spot will end up around the 30% mark on the German end. Make a spot on the line wherever this may be.
11. Repeat steps 9+10 for all the other Oracle runs, remembering to use different colours for the calculators to keep track.
12. Join these spots together with a different coloured line, forming the "bounded area" where your ancestry can be narrowed down from.
13. Completed. Make all the relevant inferences from the results, compare to the additional data in step 8 if present.
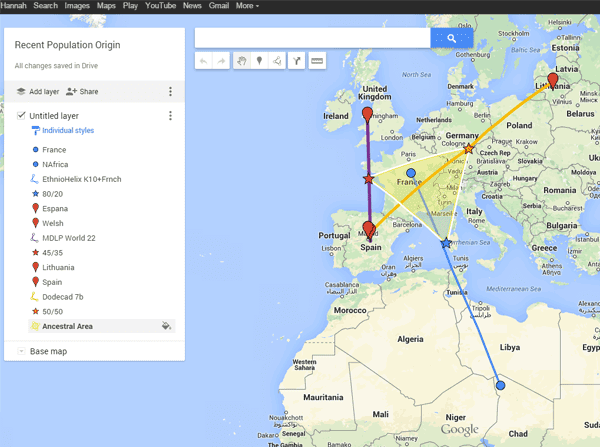 |
| My sample using Google Maps |
Disadvantages of Generalized Consumer Information
Recently I was introduced to two sources: Snpedia.com and James Licks haplogroup reader. Originally I began an excel chart looking for a map/result of correlating my major rcrs differences to known markers of each subclade. When I completed my cursory search and had found only some related to the in typed mutation I was quite disappointed. Through a happy coincidence I searched that marker coming across a blog post which indicated James Licks haplogroup reader using phylotree data. Indeed I had found what I was looking for! When I third party transferred and took my mtDNA test with Family Tree DNA they had not yet differentiated the basic and full sequence test so while I thought I was getting a awesome deal I was indeed being short changed. For most people knowing your major haplogroup is probably very helpful. The general information will no doubt apply to at least part of your research and you may choose to look no further. In researching H I began to try and guess which subclade I might be. I began to notice that much of the research on Haplogroup H was inconsistent. When I first looked it up I was told H stood for Helena featuring most women found in the area of Greece and Turkey. More recent clippings will tell you it is actually a young line found in Norway and Scotland....the inconsistency being an east or west haplogroup.
.jpg)
On advisory from a more seasoned genetic genealogist than I was the idea of charting matches to the most recent common female ancestor in the States. Of course for me this actually means Canada. Indeed my female immigrant ancestor of the mtdna line is Elizabeth 'Betty' Beck (1814-1874) who came from Dumfries-shire, Scotland to settle in Grey, Ontario, Canada with her husband John Swanston (1808-1891). From there I am to work backwards into Europe but I have a feeling the separation between North America and Europe might be better served by a more popular female such as Sebithy Ann Coultis (1857-1951) of Manitoulin Island who married William Henry Bryant (1864-1939).
Conversing on Ancestry.com has become even more limited without a subscription much to my annoyance so it will be hard work to find people matching my MRCA to compare mtdna results. Incidentally I noticed that the interactive genealogy map I made sometime ago has a strange overlay with the known path for the development of the H haplogroup both the predominant Eurasian and European subclades. Heatmaping the sources of my major subclade H2a2a has also been helpful though I intend to revise it further with matching recent populations excluding deep ancestry.

_______________________________________________________
http://dna.jameslick.com/mthap/
Monday, September 15, 2014
Third Party Confirmations!
As much as I work as a lone wolf so to speak in my genealogy work I do enjoy having others input. Recently I took the plunge and enrolled in a small tribal band of Metis-Cree people. As a help for others I explained the methods I had used so far in differentiating my own genetic markers for native blood. To my great surprise another member messaged me who was quite confident with using gedmatch himself. He is lucky enough to be a direct male descendant from Henri Membertou's band of Mi'kmaq. I was provided from him a three way match between him, myself and a even less diluted relation. The result was a positive match to the Mi'kmaq peoples. I would say to Henri himself but more likely it would be through one of his many contributing female relations.
Chr Start Location End Location Centimorgans (cM) SNPs
10 92446647 95958204 3.7 903
11 56368374 59769693 1.2 717
13 83990938 88896945 3.1 816
21 21293037 24043081 4.0 716
Largest segment = 4.0 cM
Total of segments > 1 cM = 12.0 cM
Estimated number of generations to MRCA = 7.1
Comparison took 0.05190 seconds.
Distant relation.
So this is a interesting factor in what I already know since I compose over four regions of native populations in the small sector I carry. Another cooperation comes from having limited access to my fathers genetic data. Being able to look at his smaller portion of native dna cleared up any possibility of my larger portion coming from him. Indeed my two largest portions of north amerindian and arctic do not come from him. My fathers tracers are for small portions of the south amerindian and mesoamerican. This I had already presumed but rather it is nice to have confirmed in mathematical calculation.
Another change from this last few weeks of research is discovering some depth to two of my fathers grandmothers lines. Along with that is some details on what was coined "Southern European" in earlier results. I now have confirmation through oracle population matching that my southern component is predominately Spanish with only a smattering of Italian. This follows at least the presence of late Italian ancestry in one portion of my tree but I have yet to connect the Spanish in genealogical records.
Monday, July 7, 2014
Statistical Work in Aborigional Ethnicity Prediction
Last year I set out to comb through the rough of my DNA sampling with many algorithms until I found the clearest percentages. In doing this I clustered Asiatic derivative groups under the heading of tricyclic populations as direct relation to the genealogical evidence of First Nations ancestry. However I did not at the time have a major justification for doing this except that these evidences were non compliant with the majority of my recent generational admixture. I also had my mtdna tested which is passed down from my farthest known matrilineal ancestor who came from Kirkgunzeon, Scotland. The result was the mtdna haplogroup H. I had not considered anything further about haplogroups until today.
 Someone had also recommended to me that it could be useful to make a genealogical data map. I decided to place within it known birth locations as well as the locations of genetic populations I matched. The variability of genetic population was in some ways shocking. It did however follow the typical water trade routes in it's spread. The deep Asian line however and the Americas seemed not to be related with the exception of two locales of Aleut. Recently I provided information to the younger sister's of my husband about their own native history as Saginaw band of Ojibway. I did this with only name places, some stories and a map. It surprised me how much a map can say and so I thought of this again for myself.
My statistics produced the average of hard 19%, and soft 20% if one accounts for decimals, of Native genetic material per gene. This 20% however was also not a solid component. 53% was of Inuit derivative, 38% Americas proper including Central/South and lastly a unresolved 21% that was more closely related to Asian heritage. Some strict populations that occurred were Aleut, Inuit, Pima, Maya, Ecuador, Colombia, Peurto Rican. The more exotic was Samii, Tibetian, Han, Thai.

These places however share a major component of Haplogroup. Indeed in map review of the locales it is quite evident that the underlying mtdna associated with the portions of my DNA would be Haplogroup A. The great evidence of this is that Tibetan only hosts A of those also present in the Americas. Asian haplogroups are the predecessor of native american strands which is why it is proper to review them together especially in the absence of actual Asian heritage.
Since Catherine Dufour spoke French-Cree I have come to the assumption that she was Métis-Cree herself as other varieties of Metis would speak their own aboriginal language. Of the localized groups the Cree associated with the region she lived refer to themselves as the Innu. I would not however assume to be exact on which regional tribe of the Cree Catherine came from until we ever have the exact name of her mother. There remains as well the possibility that her father Peter was also of mixed ancestry. Within the Boussey family work I am lucky to have not only a exact name for Anne Marie dit Metisse but also the Indian settlement she lived. Port Royal, Nova Scotia is under the Bear River Nation of Mi'kmaq today. It would be lovely to have exacting answers but native american DNA methods are extremely limited.
My statistics produced the average of hard 19%, and soft 20% if one accounts for decimals, of Native genetic material per gene. This 20% however was also not a solid component. 53% was of Inuit derivative, 38% Americas proper including Central/South and lastly a unresolved 21% that was more closely related to Asian heritage. Some strict populations that occurred were Aleut, Inuit, Pima, Maya, Ecuador, Colombia, Peurto Rican. The more exotic was Samii, Tibetian, Han, Thai.
These places however share a major component of Haplogroup. Indeed in map review of the locales it is quite evident that the underlying mtdna associated with the portions of my DNA would be Haplogroup A. The great evidence of this is that Tibetan only hosts A of those also present in the Americas. Asian haplogroups are the predecessor of native american strands which is why it is proper to review them together especially in the absence of actual Asian heritage.
Since Catherine Dufour spoke French-Cree I have come to the assumption that she was Métis-Cree herself as other varieties of Metis would speak their own aboriginal language. Of the localized groups the Cree associated with the region she lived refer to themselves as the Innu. I would not however assume to be exact on which regional tribe of the Cree Catherine came from until we ever have the exact name of her mother. There remains as well the possibility that her father Peter was also of mixed ancestry. Within the Boussey family work I am lucky to have not only a exact name for Anne Marie dit Metisse but also the Indian settlement she lived. Port Royal, Nova Scotia is under the Bear River Nation of Mi'kmaq today. It would be lovely to have exacting answers but native american DNA methods are extremely limited.
Subscribe to:
Posts (Atom)